- | Housing Housing
- | Policy Briefs Policy Briefs
- |
Expanding Maryland’s Housing Stock: A Roadmap to Meeting Housing Targets
Governor Wes Moore’s administration has adopted a goal to increase the housing supply in Maryland by 96,000 housing units. [1] This would constitute a 4 percent increase in the state’s housing stock—a target that is modest relative to the demand for housing in Maryland, and at the same time ambitious relative to Maryland’s baseline policy context. This policy brief tries to map out a realistic path to achieve this goal:
We argue that good zoning policies deliver over decades.
We imagine the types and locations of housing that would be enough to meet thegovernor’s goal.
We warn against the false choice between abundance and affordability.
Reference Points
Maryland has about 2.5 million housing units. Local governments in the state report issuing about 18,000 building permits per year. [2] The state likely loses about 9,000 units per year to demolition, disaster, and deterioration. [3] The net growth rate of the housing stock, 0.36 percent per year, is one-half to two-thirds of what the state needs to retain its share of the US population. [4]
Any estimate of housing need is a moving target, because markets are dynamic. States that provide abundant housing attract migrants—people not previously counted as “needing housing.” Taking dynamic migration and other sources of demand into account, economists estimate that the rent elasticity of demand is about negative two-thirds. [5] That means that every 2 percent increase in a metro area’s housing stock reduces rent by 3 percent, all else equal. That’s a long-term estimate; in the short term, new lease rents can fall more sharply.
Although metro area estimates do not translate perfectly to the state level, the rent elasticity of demand suggests that a 4 percent increase in the housing stock is just a beginning—slowing the growth of rents and prices by a few percentage points would be welcome, but not transformational.
Good Institutions Create a Stream of Housing
Although economists find it easier to think in terms of static comparisons, cities change—slowly. A large, sudden reduction in regulation creates a slow, steady stream of new housing. The gradual nature of this change is partially due to physical reasons: construction requires investment in skilled workers and equipment. It only makes sense to invest in skills or machinery if long-term, steady work is expected. But change is gradual also because housing markets absorb new supply slowly. When thousands of new units are delivered in a short period, many sit vacant, losing money, as the market gradually adjusts to fill them. [6]
One example of the persistent effects of regulation on housing construction is in Arlington County, Virginia. Metro corridors were designated for transit-oriented development back in the 1970s. Even though Arlington is one of the smallest counties in the US, developers there have been thumping out an average of 925 apartments per year in the last 45 years. We at Mercatus witnessed the gradual nature of this change: a large parcel, enviably located near the Clarendon Metro station, used as a taxicab company’s parking lot until 2021, has finally been developed, and new apartments are available for leasing as of this writing. [7]
We can point to other examples across the country. California’s accessory dwelling unit (ADU) reforms (contained in at least eight bills over several years) undammed a steady stream of investment. New data show that ADU production has grown each year, nearing 25,000 applications and 18,000 completions in 2022. In Houston, minimum lot size reforms have delivered on average 1,900 townhouses per year for 25 years but with strong business-cycle variation. [8] Duplex zoning in Palisades Park, New Jersey, has resulted in the replacement of about 1.2 percent of all single family homes with duplexes each year for decades. Since 1960, the population there has doubled and the property tax rate has fallen, unlike in neighboring towns. [9] In the state next door, after a creative downtown upzoning plan, New Rochelle, New York, awoke from permitting less than 100 units per year to over 800. [10]
In each case, decisive reform did not lead to a one-time surge in development. Instead, reforms raised the baseline rate for years—even generations. Permissive regulations are part of the institutional mix, along with a building industry attuned to local markets, that enables a steady flow of housing units.
A Path to 96,000
With these principles in mind, what is a realistic path to Governor Moore’s 96,000-unit goal? We convert this to annual thinking: 10,000 permits per year—over and above Maryland’s 18,000 baseline—as a 10-year path to 96,000, with a cherry on top. What mix of policies could reasonably get us there? We outline one pathway in table 1.
It is challenging to predict the outcomes of even the best-designed reforms. And while we make no pretense of rigor in this section, we have tried to be honest, realistic, and grounded in experience. For all these housing supply reforms, we are thinking of realistic but high-quality versions of the relevant policies. For each of them, a totally ineffective version also exists.
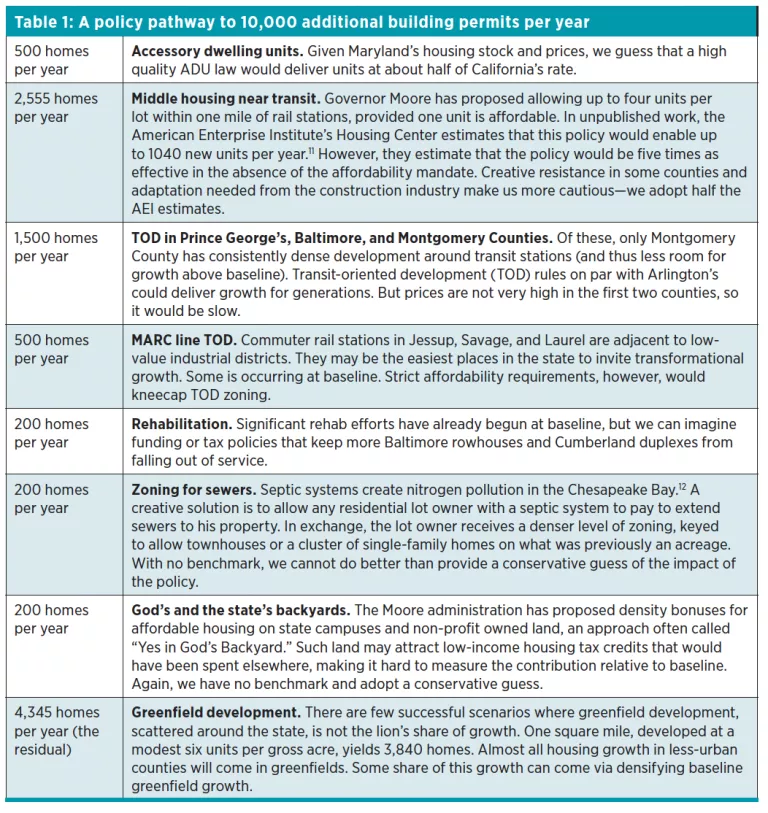
What stands out starkly in the table above is that there is little prospect for achieving the governor’s goal with affordable infill strategies only. This policy brief does not contemplate the kind of big policy changes that would unlock dense, high-quality growth in greenfield areas—but we cannot chart a path to success without a large contribution from densifying and extending the state’s greenfield growth.
How Deep Can the Market Reach?
Maryland’s housing policy debate risks derailment by the false choice between abundance and affordability. Without assistance, the poorest people end up living in conditions below modern standards—in housing that is crowded, inaccessible, or unsafe, or even in tents. Policymakers should direct subsidies at those most in need, allowing those with moderate means to house themselves. And policymakers should welcome market-rate housing on its own terms—as a product that can even serve Marylanders with incomes well below the median.
As figure 1 shows, housing affordability problems are concentrated among the quarter of the state’s households earning less than $48,000. However, this group is crowded out of many affordability programs by people earning as much as 60 percent area median income (AMI)—which is $73,000 in the Baltimore metro area, a level at which the median Maryland household spends just 24 percent of its income on housing costs.
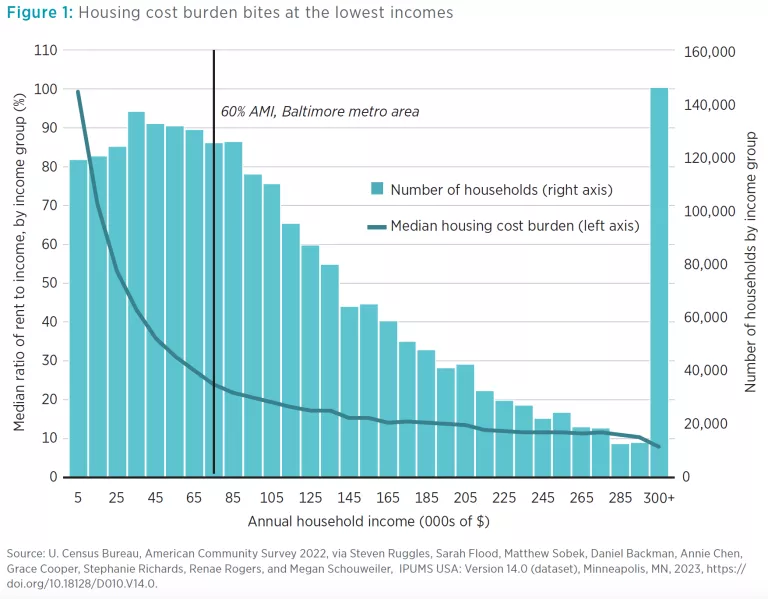
Indeed, for people with moderate incomes, even new construction can be attainable. For example, in Montgomery County, the typical renter household living in a unit built since 2010 has a total monthly housing cost of $2,050, affordable to a household earning 54 percent of AMI.
Some Maryland localities have turned to local inclusionary zoning (IZ) mandates in an attempt to improve housing affordability. [13] The Moore administration proposes to expand IZ, but on a voluntary basis. Usually, these programs produce little housing and set it aside for households earning as much as 60 percent of AMI, sometimes more, thus failing to serve the least-well-off households.
The IZ approach to affordability is precisely attuned to do little to ease housing unaffordability for those with low incomes while also making housing scarcer at all levels of the income distribution. A more robust approach is two-fold: (1) let builders get to work on market-rate housing, which pays for itself and opens up the filtering process, [14] and (2) supplement the incomes of those in the greatest need.
Conclusion
As this policy brief has argued, Maryland builders will find housing construction opportunities in diverse places, including transit stations, established neighborhoods, and unimproved land. All of those will be needed to meet Governor Moore’s goal. However, each also needs policy intervention at the county or state level to legalize construction of different styles and densities. And none is likely to grow at scale if legalization is encumbered with unfunded affordability mandates.
Notes
1. Josh Kurtz, “State Leaders Promise Vigorous Housing Agenda but Tenant Advocates Sweat the Details,” Maryland Matters, December 22, 2023.
2. Sid Kapur, “Maryland,” (database based on US Census Building Permits Survey), (accessed January 22, 2024), https://housingdata.app/states/Maryland.
3. This assumes Maryland’s housing stock follows the US average. “Changes in the US Housing Stock and Rental Market Dynamics,” US Department of Housing and Urban Development’s Office of Policy Development and Research, PD&R Edge, September 28, 2020.
4. The US population is likely to grow about 0.5 percent per year this decade, but the number of households will grow faster due to aging, low birthrates, and rising affluence.
5. David Albouy, Gabriel Ehrlich, and Yingyi Liu, “Housing Demand, Cost-of-Living Inequality, and the Affordability Crisis,” (National Bureau of Economic Research Working Paper #22816, November 2016).
6. Andreas Mense, “Secondary Housing Supply,” (Geography and Environment Discussion Paper Series 40, Department of Geography and Environment, LSE, London, UK, 2023).
7. “Lease by 1/31 and Receive 6 Weeks Free,” Alexan Fitzroy Apartments (website), accessed January 2024, https://alexanfitzroyapartments.com/.
8. Salim Furth, “Resources for Reformers: Houston’s Minimum Lot Sizes,” Market Urbanism, January 11, 2024.
9. Edward Pinto, Tobias Peter, and Emily Hamilton, Light Touch Density: A Series of Policy Briefs on Zoning, Land Use, and a Solution to the Nation’s Housing Shortage, (Washington, DC: American Enterprise Institute Housing Center, January 2022).
10. Salim Furth and Philip Wharton, Case Study: New Rochelle: Zoning and Permitting Innovations Unlock Opportunity, (Better Cities Project, June 2021); Sid Kapur, “New Rochelle, NY,” (database based on US Census Building Permits Survey), (accessed January 22, 2024), https://housingdata.app/places/NY/New_Rochelle.
11. Unpublished memorandum, January 2024, based on Light-Touch Density Estimates, AEI Housing Center, https://heat.aeihousingcenter.org/ltd-map.
12. Melanie Harrison et al., “Smart Growth and the Septic Tank: Wastewater Treatment and Growth Management in the Baltimore Region,” Land Use Policy 29, no. 3 (July 2012): 483–92; Ethan Hain et al., “Geospatial and Co-occurrence Analysis of Antibiotics, Hormones, and UV Filters in Chesapeake Bay (USA) to Confirm Inputs from Wastewater Treatments Plants, Septic Systems, and Animal Feeding,” Journal of Hazardous Materials 460, no. 15 (October 2023).
13. Most studies of IZ, including Hamilton’s own study of the Baltimore-Washington region, find that it raises median housing costs, indicating that it hurts many of the households who aren’t lucky enough to secure an income-restricted unit. Emily Hamilton, “Inclusionary Zoning Hurts More Than It Helps,” (Mercatus Policy Brief, Mercatus Center at George Mason University, Arlington, VA, February 2021); Emily Hamilton, “Inclusionary Zoning and Housing Market Outcomes,” Cityscape 23, no. 1 (2021): 161–94.
14. Michael Manville, Michael Lens, and Paavo Monkkonen, “Zoning and Affordability: A Reply to Rodríguez-Pose and Storper,” Urban Studies 59, no. 1 (August 2020): 36–58.

