The Midyear Economy
By many key measures—employment, industrial production, corporate profits—the midyear economy is looking healthy and experiencing growth. 2018’s prospects relative to the recent past are improving. Put another way, the foundation stones that support economic activity are relatively stout.
At the same time, there are some cracks in the foundation that need to be considered. These include tariffs and other limits on world trade either imposed or threatened by the Trump administration, questions about inflation and Fed policy, and economic policy uncertainty generally. Since the first of the year, the Trump administration has imposed tariffs on Canadian dairy products, and Chinese solar panels and washing machines, has threatened world tariffs with negotiated exceptions for steel and aluminum imports, and most recently has called for tariffs on foreign-produced automobiles. Along with these comes a growing list of tariffs on multiple Chinese goods, followed, of course, by threats of Chinese and EU retaliation. America’s trade disputes raise serious questions regarding economic growth over the next two years. I will give a more complete discussion of this point later.
As to Fed policy, we have already been more or less assured that the Fed will raise interest rates multiple times across the next 12 months. We don’t know, of course, the magnitude of the nudges or when they may be heaviest. At issue is the degree to which the economy’s momentum can absorb the multiple increases. I’m betting that the increases will not disable the expected continuation of GDP growth. Higher economic policy uncertainty goes logically with dramatic changes that are occurring with respect to financial deregulation, sharp revisions in EPA rules and procedures, as well as current trade and trade treaty disputes. Yet even in the face of higher policy uncertainty as measured, for example, by the Economic Policy Uncertainty Index, the US economy seems to be jogging apace.
2018’s GDP Growth and the Economy’s Top Speed
Turning to the general outlook, the Department of Commerce’s May 30 estimate for first-quarter GDP growth came in at 2.2 percent, which is close to the top speed set by productivity gains and labor force growth (more on this later). At the same time, the 2.2 percent first-quarter estimate was just slightly below 2017’s 2.3 percent average growth rate for the year. (I note that 2016’s GDP growth was 1.6 percent.) Somewhat offsetting the good news, the department reported that the fourth-quarter GDP price index rose 2.7 percent, versus 2.5 percent in the fourth quarter. Inflation seems to have returned.
These healthier Department of Commerce numbers support the Federal Reserve Board’s recent optimistic revision to US GDP growth for 2018. At the March meeting, the board lifted the estimate to 2.7 percent from their September 2.0 percent. The higher estimate was in harmony with the International Monetary Fund’s April World Economic Outlook, which pegged 2018’s world GDP growth at 3.9 percent.
Have we reached a transition point? Has the sleepwalking economy finally awakened? Should we expect to see 3.0 percent growth over the next 12 months? Yes, the economy is surely growing faster. Income tax cuts and regulatory reform together are making a difference. Still, I would not bet on 3.0 percent growth for 2018 or 2019. An assessment of current data and trends suggests sustained 3.0 percent GDP growth is not in the cards. We may see 2.8 percent growth for 2018, however.
Many economists agree that any economy has a top speed—no matter how much government leaders might think otherwise. Two determining factors setting that limit are how many people go to work each day and how productive they are when on the job—in other words, growth in the labor force and growth in labor productivity.
Adam Smith suggested as much in 1776 when he pointed out that the wealth of a nation is “regulated by two different circumstances; first by the skill, dexterity, and judgment with which the labour is generally applied; and secondly, by the proportion between the number of those who are employed in useful labour, and that of those who are not so employed.”
So how do the revised Commerce Department and Fed GDP growth estimates compare with the most recent data on labor productivity and labor force growth? Close, I am glad to say. Data for 1Q 2018 from the Federal Reserve Bank of St. Louis set productivity growth at 1.30 percent on a year-over-year basis. The same source shows 1Q 2018 labor force growth at 1.00 percent. Added together, these numbers give a top speed of 2.30 percent real GDP growth. Of course, productivity growth does vary from quarter to quarter, and new business investment can improve that number. It’s also true that the labor force can show more growth. The five-month moving average count of employment growth tells us that employment turned a corner in September 2017 and has moved along a positive trend line since then. Even so, we should not expect to see sustained 3.0 percent GDP growth anytime soon, and we should look out for higher inflation in late 2018 and in 2019.
Death by China or Life by Trade
The Trump administration seems intent on avoiding “death by China.” This is the name of a 2011 documentary film produced by Peter Navarro—currently special adviser to the president. Mr. Navarro’s thesis is simple: China’s rise to the status an economic juggernaut came at the expense of the United States, specifically as Chinese exports to the United States translated into lost jobs and lower incomes for Americans. This thesis disregards some basic economic facts.
When a nation like the United States consumes annually more resources than it produces, there have to be other countries that produce more than they consume. China, of course, falls into the latter category.
A separate question is whether China plays fair by the international rules of commerce. It is true that China’s violations of trade law, onerous limitations on US exporters, and weighty restrictions on US service providers have a negative effect on the US economy. However, the US State Department, the Office of the United States Trade Representative, and the White House deal with those matters and can avail themselves of mechanisms currently in place for doing so. But we should not confuse the trees for the forest: the American economy gains from Chinese shipments of goods and services, and certainly from the reverse flow of dollars generated by Chinese exports to the United States.
How does it happen that the United States is such a seemingly spendthrift nation of people? Have we lost our way in an economic wilderness? Well, not exactly. First, the United States is a haven for new investment in patents, real estate, and advanced manufacturing. American savers simply do not supply enough dollars to meet investment demand. People worldwide fill in where we leave off, and they demand dollars to fund investments. As the Wall Street Journal’s Greg Ip pointed out recently, the US investment shortfall has risen recently to $54 billion per month from a monthly average of $46 billion over the previous 12 months. If we close our borders to Chinese goods but do nothing to reduce our growing federal deficit or to increase our savings, what will happen? The lack of competition from internationally produced goods will lead to higher prices, the disappearing pool of US dollars held by Chinese individuals who previously sold goods in the United States will lead to higher interest rates on US government bonds, and a slowing US economy will need less foreign investment. GDP growth will fall, and we will all be poorer.
How Trade Policy Becomes Industrial Policy
Measured by actions taken to limit entry of foreign-produced goods to the domestic economy, America is not a notable free trader. Consider this: the Global Trade Alert produced by Switzerland’s University of St. Gallen tracks the frequency of trade intervention efforts across 140 countries. During the period of November 2008 through December 2017 there were 9,743 interventions worldwide. Of these, the United States led the world with 1,376. China had 309. Across products and industries, iron and steel were the leading protection petitioners. This may be explained by the fact that steel production involves very high fixed costs, giving a tendency for steel producers worldwide to sell below full cost—while covering variable cost—during recessions and economic slowdowns.
The recently announced steel and aluminum tariffs illustrate how trade policy becomes industrial policy that enables politicians to pick tariff-avoiding winners and tariff-paying losers. The mechanism by which winners and losers are to be determined was described in a March 19 Federal Register notice bearing the ponderous title “Requirements for Submissions Requesting Exclusions from the Remedies Instituted in Presidential Proclamations Adjusting Imports of Steel into the United States and Adjusting Imports of Aluminum into the United States; and the Filing of Objections to Submitted Exclusion Requests for Steel and Aluminum.”
By selecting steel and aluminum—basic metals needed by an almost endless list of firms and industries—and by giving the tariff program a defense rationale, the White House artfully made Secretary of Commerce Wilbur Ross America’s industrial policy czar. The reach of the proclaimed policy is indicated by frequently cited employment numbers for the 6.5 million workers employed in aluminum- and steel-using industries versus the 165,000 directly employed US workers producing those two materials. The weakness of the defense rationale is portrayed by the report that only 3 percent of the output of the two affected industries goes to defense. As it turns out, 6.5 million US workers now face a less sunny future, given the impact of tariffs on their jobs, but those same workers can seek balm in Washington, if their employers will just take some time from competing and petition for relief.
Generally speaking, economists who oppose tariffs do so because of the cost imposed on all consumers taken together. Tariffs interfere with gains from trade and make the average citizen poorer. But when a tariff program is administered by politicians who can pick industrial winners and losers, the potential cost to the economy becomes more crippling. Along with higher-priced consumer goods—and fewer of them—we get a politically entangled, less vibrant economy and a sad case of economic hardening of the arteries. But while all this seems bad enough, the program also allows President Trump to decide which countries will be winners and losers, since he has the power to lower the tariffs for those that he favors.
If the current trade war threats become a reality, it is possible that the economic gains from regulatory and tax reform will be more than offset by losses from tariff and industrial policy. In developing the forecast for 2018, I am assuming those losses will not occur.
The Midyear Forecast
I have made only minor adjustments in my 2018 forecast for key economic variables:
- GDP growth will average 2.8 percent.
- Inflation will rise a bit. Look for 2.5 percent by year end.
- Interest rates will nudge up. By year end, the 10-year bond will yield 3.15 percent and 30-year mortgage rates will hit 4.30 percent.
- Housing will be strong, especially single-family construction and sales; auto production will be flat.
- The pace of manufacturing activity will accelerate, led by machinery.
The Geographic Imprint
In the March situation report, I provided a Department of Commerce map reporting the wide-ranging real GDP growth across the 50 states. I now provide a more analytical Commerce Department map that places the 50 states into four categories based on their GDP growth relative to that of the nation. The categories are “leading”—which we might think of as bellwether states—“slipping,” “gaining,” and “lagging.”
States are placed in each category by comparing each state’s GDP growth for the periods 2010–2016 and 2016 alone with the national growth rates for those two periods. If a state’s growth rate exceeds the national rate for both periods, it is a leading (or bellwether) state. If growth for the longer period is greater than the nation’s rate of growth but falls short for 2016, then the state is slipping. If growth for the longer period is weaker than the national growth but stronger for 2016, the state is gaining. But if a state is weaker for both periods, then the state is labeled as lagging.

The 12 green-colored bellwether states are California, Georgia, Indiana, Iowa, Michigan, Minnesota, Nebraska, Oregon, South Carolina, Tennessee, Utah, and Washington. Geographically widespread, seven of these are west of the Mississippi, three are in the South, and two are located in the upper Midwest east of the Mississippi. As the map indicates, the lagging brown states are located along the Mississippi River and concentrated in the country’s eastern half. I note that many of the slipping states specialize in energy production.
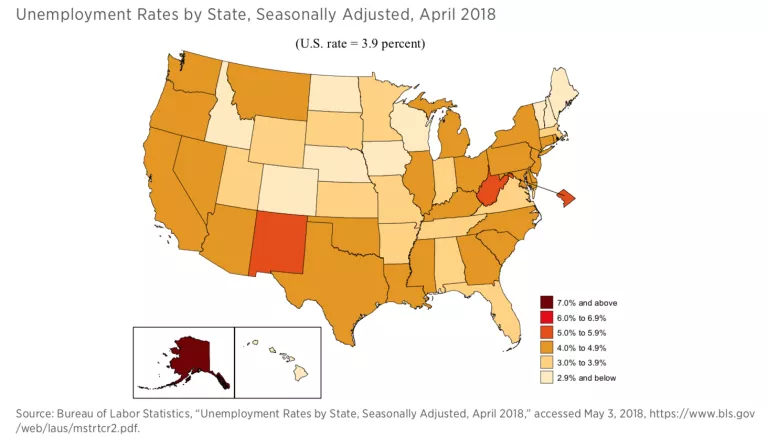
The Changing Unemployment Picture
Obviously, a lot has happened on the employment front since the end of the 2008 recession. The tightening of labor markets is seen most vividly in Bureau of Labor Statistics maps that provide state unemployment rate data. For comparison, I provide a map that shows annual average state unemployment rates for 2013 and a map of state unemployment rates in April 2018. The two maps speak for themselves, but it is worth noting that lower unemployment rates prevailed in both periods at the center of the country beginning at the top with North Dakota.

The Nonprofit States
My third state outline map addresses how economies are structured. Produced by the Federal Reserve Bank of Minneapolis, the map shows the share of total state employment accounted for by 501(c)(3) nonprofit organizations. This part of the nonprofit sector includes universities, hospitals and healthcare organizations, and charitable organizations. In 2014, more than 293,000 charities nationwide with $3.7 trillion in assets were exempt from federal taxes. The underlying data for the map were developed by the Bureau of Labor Statistics in 2016. Notice that the share of employment in the nonprofit sector ranges from a high of 26.6 percent in the District of Columbia to a low of 2.7 percent in Nevada. From 1985 to 2014, this burgeoning sector showed a cumulative growth of 141 percent while cumulative real GDP growth was 76 percent.

The fact that there is no robust literature linking the size of the nonprofit sector to the larger economy does not mean we should not monitor the evolution of this sector and begin to test some plausible hypotheses. For instance, increase in wealth is correlated to increase in income for nonprofits, particularly when the portion of new wealth devoted to philanthropy is a constant over time. At the same time, jobs in the nonprofit sector tend to require higher qualifications than jobs at the shop floor; the trends in the labor force in the nonprofit sector may thus be an indicator of trends in a cross-section of the labor force that is not otherwise easy to track with a traditional industrial classification. Finally, it may be useful to examine whether new regulations are connected to advocacy issues of the nonprofit sector in areas such as environmental or occupational hazard regulations. If this were the case, the growth of the nonprofit sector could signal the emergence of new political forces with a say on regulatory policy.
The Philanthropy Situation
Any assessment of nonprofits leads directly to consideration of philanthropic giving. How is America doing? According to the data from the 2016 Giving Report, US philanthropic giving that year hit $390 billion. That’s about 2 percent of disposable income, a level that has tended to prevail for 40 years. Adjusted for inflation and summing across all donor categories—individuals (72 percent), foundations (15 percent), bequests (8 percent), and corporations (5 percent)—US giving is just now fully recovered from the 2007 prerecession level. The trek to recovery took nine years.
One might expect this, but levels of individual giving closely track the S&P 500 index. As we all know, 2017 was a very good year for investors. Systematically, two-thirds of American families make an annual donation to some charitable cause. In doing so, they reveal shifting preferences as to how their gifts are targeted. In terms of broad recipient categories, religion is the loser. Religion received 45 percent of all gifts in 1996; its share in 2016 was 36 percent. The decline follows mainline church membership trends. So what’s on the rise? The share received by healthcare organizations rose from 8 percent in 1996 to 13 percent in 2016. I note that education’s share rose from 13 percent to 15 percent.
Part of the shift in giving patterns is explained by demographic data. As generations are considered, the younger givers are, the more likely they are to shift their gifts away from religious organizations. The so-called greatest and silent generations were high on church attendance and giving. By contrast, Generation X and millennials rank lower on church attendance as well on as charitable cash giving. But they are high on engagement with charitable organizations and investing in nonprofits involved in good works. In a sense, they are cutting out the middleman. Falling transaction costs are taking a toll on firms and organizations that emerged in higher-transaction-cost periods.
Is the United States the planet’s most generous nation? It depends on how you count. But the answer is a negative according to the 2016 World Giving Index, which is based on Gallup surveys across 140 countries. Yes, the United States was number one in 2014, but it fell to second place in 2016. The small country Burma is now number one. Australia is number three, followed by New Zealand and Sri Lanka. By the way, the World Giving Index has three components: financial giving, assisting strangers, and volunteering. The United States is not in first place for any category.
Utah in the State Spotlight
Patrick A. McLaughlin | Senior Research Fellow, Director of the Program for Economic Research on Regulation, Mercatus Center at George Mason University
Jonathan Nelson | Program Coordinator, Mercatus Center at George Mason University
Each quarter, we select one state economy and assess that economy’s economic health and growth prospects. We also examine the state’s regulatory environment. Last quarter we put Colorado in the spotlight. In previous quarters, we have examined Oregon, Kentucky, Michigan, and North Carolina. We focus on Utah this quarter.
In the past year, Utah has enjoyed a period of exceptional economic growth. The state’s personal income grew at 4.4 percent during 2017, better than the nation’s growth rate of 3.9 percent. The largest contributor to Utah’s increase in personal income from 2016 to 2017 was a 5.2 percent increase in private nonfarm earnings. Part of this growth was driven by people voting with their feet. In recent years, Utah has experienced the fifth-largest growth in population among the 50 states, growing by 11.8 percent between 2009 and 2016. The following chart shows the growth in population between 2009 and 2016 for the top 10 fastest growing states. It is interesting to note that 6 of the top 10 states are in the western region of the United States.


Utah’s recent economic strength has in part been the result of its hardworking and entrepreneurial residents. Many commentators suggest that the large Mormon population (nearly two-thirds of the total state population) is responsible for the strong work ethic of Utahns. Brigham Young University is the largest university in the state, despite being a private Mormon-affiliated institution. The university consistently produces strong STEM and business students, a combination that leads to success in the modern, technology-focused economy.
According to CNBC’s “America’s Top States for Business 2017,” Utah ranks eighth in the nation. The state’s high rank comes from their strong economy, solid workforce, and business-friendly legal and regulatory environment. In fact, Utah has been dubbed by some as the “next Silicon Valley” because of its growth of successful tech companies. Specifically, cloud computing has grown into a successful industry in Utah. According to Forbes’ The Cloud 100 World’s Best Cloud Companies report, 6 of the top 100 cloud companies in the world are headquartered in Utah, including Qualtrics, Domo, Pluralsight, Workfront, Health Catalyst, and InsideSales (55 of the top 100 companies are in California). Other top-performing industries in the state include medical-device manufacturing and aerospace. The success of the tech sector is the result of both the state’s entrepreneur-friendly policies and its entrepreneurial workforce.
As we saw with Colorado in the last edition of the Economic Situation, the winter tourism and sporting goods industries are also important for Utah’s economy. Though the industry is largely dependent upon the weather (more snow generally means more winter sports tourism), marketing research firm RRC Associates reported in 2015 that skiing tourism was responsible for adding nearly $1.3 billion to the Utah economy.
Like many other states, Utah’s unemployment rate has plummeted since the 2008 recession. As of February 2018, Utah’s unemployment rate is 3.1 percent, nearly a whole percentage point less than the national rate of 3.9 percent. One of the state’s strongest measures is its high labor force participation rate of 69.2 percent, ranking fourth in the nation, only behind North Dakota, Minnesota, and the District of Columbia.
Utah is a good performer in educational attainment, ranking 10th among the 50 states with 91.5 percent of the adult population having graduated from high school and ranking 17th with 31.8 percent of the adult population having bachelor’s degrees.
What about the future? There are two indicators to consider: The first is the current state leading indicator produced by the Philadelphia Federal Reserve Bank. The indicator predicts the six-month growth rate of the state’s economy. The indicator is determined by past economic performance, as well as other variables that lead the economy, including state-level housing permits and state initial unemployment insurance claims. As of March 2018, the indicator is very positive for Utah, predicting 4.4 percent growth over the next six months.
A second assessment of future prospects relates to the extent to which a transition is being made toward the emerging knowledge economy. The New Economy Index produced by the Information Technology and Innovation Foundation provides this assessment. The most recent report shows that Utah ranks near the top of the 50 states with respect to knowledge jobs, economic dynamism, the size of the digital economy, and innovation capacity. The state is below average only with respect to its entry into the globalized economy. Overall, Utah ranks ninth in making the transition to the new economy.
In terms of overall fiscal solvency, the state government of Utah is doing much better than many other states, ranking fourth in the nation in 2017 according to the State Fiscal Rankings project by the Mercatus Center at George Mason University. Like many other states, Utah’s worst-performing area is its management of state pensions, which has an unfunded liability of $35.66 billion, or 30 percent of state personal income.
Utah’s Regulatory Outlook
Utah’s regulatory code is published in the Utah Administrative Code (UAC) and contains more than 5.4 million words. Even as a full-time job, it would take someone about seven and a half weeks to read the entire code, assuming a pace of 300 words per minute, 40 hours per week.
RegData found 88,150 regulatory restrictions in the UAC (regulatory restrictions are the words and phrases shall, must, may not, prohibited, and required, and can signify legal constraints and obligations). Utah’s state regulatory burden is well below the median number of restrictions (133,156), ranking third-lowest out of the 22 states that have been analyzed so far. Compare Utah to New York, the most regulated state, with 307,636 restrictions, and Arizona, the least regulated, with 63,919.
In addition, RegData identified the most-regulated industries in Utah. The top five regulated industries are chemical manufacturing (5,489 restrictions), nursing and residential care facilities (2,421 restrictions), utilities (2,091 restrictions), petroleum and coal products manufacturing (2,000 restrictions), and animal production and aquaculture (1,981 restrictions). Many of these restrictions come from the Department of Environmental Quality. This department alone is responsible for 22,746 regulatory restrictions, over a quarter of all restrictions in the state.
While less regulated in Utah than in many other states, chemical manufacturing is generally a highly regulated industry at both the state and federal level. The industry is regulated by 100,119 federal restrictions in addition to the 5,489 state-level restrictions in Utah. Other states where chemical manufacturing is the most highly regulated industry include Florida (9,049 restrictions), Illinois (22,128 restrictions), New York (16,252 restrictions), Ohio (10,589 restrictions), and Virginia (7,238 restrictions).
Utah is embracing the changing economic landscape more than many other US states, and the state is reaping the economic benefits. Between their hardworking and innovative population and the promarket legal and regulatory environment in the state, Utah is set up to have years of economic success well into the future.
Yandle’s Reading Table
At a time when the Trump administration is announcing a return of protectionism, what could be more appropriate reading material than Douglas A. Irwin’s magnificent and encyclopedic Clashing over Commerce: A History of US Trade Policy (University of Chicago Press, 2017)? At first glance intimidating because of its 860 pages, Clashing is well worth the time it takes to read. Let’s face it, hardly anyone will read this book straight through, say, in one week. But many will read in selective installments. Along the way, one will learn surprising things.
For example, the Boston Tea Party was not about the price of tea and taxes imposed on it. In fact, the price was falling. Instead, the much-celebrated event was about England’s insistent monopolization of trade. More disheartening, perhaps, readers will learn that protectionism for most of the nation’s political history was seen in a very positive light, almost as an adjunct to logical market-based policies designed to support a capitalistic economy. One reads, “In 1890, William McKinley of Ohio triumphantly stated, ‘We lead all nations in agriculture, we lead all nations in mining, and we lead all nations in manufacturing. These are the trophies which we bring after twenty-nine years of a protective tariff. Can any other system furnish such evidences of prosperity?” Without displaying any ideological bias at all throughout the book, Irwin carefully and systematically examines McKinley’s assertion and, among other things, points out that the nation’s remarkable GDP growth heralded by McKinley was associated with high population growth as well as acceleration in total factor productivity that came with rapid capital accumulation. Indeed, net investment rose from 10 percent of GDP prior to the Civil War to 20 percent afterwards. In other words, as is almost always the case when considering relative prosperity, there were several forces at play.
Anyone who may think that the current acrimonious US political split is unprecedented needs to read Irwin’s treatment of sectional conflicts that arose in 1816–1833. What we have now, by comparison, is like a proverbial church picnic. High tariffs formed the basis for the conflict. Historically, the United States relied on tariff revenues to fund the government; there was no income tax. But by 1830, northern industrialists had seized on the tariff as a way to ward off foreign competition. At that time, average tariffs were 62 percent, the highest level in US history. The push for higher tariffs had been led by Speaker of the House Henry Clay of Kentucky. As Clay put the matter, “We must naturalize the arts in our country by the only means which the wisdom of nations has yet discovered to be effectual—by adequate protection against the otherwise overwhelming influence of foreigners. This is only to be accomplished by the establishment of a tariff.” Most readers will recall the struggle against tariffs led by South Carolina’s John C. Calhoun that pitted the world-trading agricultural states against the northeastern manufacturers who wanted tariffs on competing goods. Calhoun’s fear of sectionalism and belief that the use of tariffs for protection instead of for revenue alone was unconstitutional led to a proposal for a revised constitution that would require concurrent state majority approval of federal laws, a proposal that went nowhere.
As might be expected, Irwin devotes a chapter to the Smoot-Hawley Tariff and the Great Depression. Irwin begins his discussion with the 1928 election of Herbert Hoover, who won under a Republican banner that saw a protective tariff as an “essential principle of the economic life of [the] nation.” At the time, agriculture was in the pits. In December 1928, the House Ways and Means Committee began a series of tariff hearings that went on for 43 days and involved 1,100 witnesses. The committee report, which was almost microscopic in its examination of items to be protected, contained more than 10,000 pages. This was followed by a Senate committee hearing that heard from 1,004 witnesses and generated more than 8,000 pages of testimony.
After almost 18 months of political jockeying, the Smoot-Hawley bill was passed. Its mind-numbing 200 pages set tariffs for 3,300 items. For tariffs already on the books, the new law increased rates for 890 items, reduced rates for 235, and left rates for 2,170 items unchanged. Obviously, things were different in 1930. Today, President Trump can almost casually announce an increase in tariffs on steel and aluminum without being able to provide any details regarding what is covered and what is not. Smoot-Hawley became effective as the industrialized world was experiencing the start of the Great Depression. Between 1929 and 1932, the United States experienced one of the largest reductions of trade in history. But as Irwin points out, only part of this collapse can be attributed to the tariff act itself.
Irwin gives special treatment to key politicians who affected meaningful changes in US trade policy. Franklin D. Roosevelt’s secretary of state Cordell Hull was one of these. Indeed, as Irwin tells the story, Hull became consumed by a free trade passion that motivated his entire political career. While fully recognizing and appreciating the linkages between expanding world trade and rising prosperity, Hull also came to recognize that “you could not separate the idea of commerce from the idea of war and peace.” On Hull’s leadership, Irwin indicates that Hull was a “pivotal figure in the history of US trade policy” and that his success “demonstrates that individuals, not just impersonal economic and political forces acting through Congress, can shape policy at critical moments.”
I recommend Irwin’s book for any reader who really wants to know about US trade policy.
In Capitalism without Capital (Princeton University Press, 2018), Jonathan Haskel and Stian Westlake provide an enlightening and stimulating discussion of the modern intangible-goods-rich economy—what it is, how it is measured, and how economic outcomes are affected when intangible assets become prevalent. Haskel is a professor of economics at Imperial College London; Westlake is a senior fellow at NESTA, the United Kingdom’s national center for innovation. The book, which I believe makes an excellent selection for a book club (for those fortunate to participate in one), is quite well written and usefully organized.
The book begins with a discussion of the pending breakup of the British Airports Authority and the estimation of the values of airports to be sold. The brief discussion, which will appeal to accountants, economists, and others who keep up with asset evaluation, points out that, of course, value assessment has to do with counting up assets and assigning prices to them; but what might be termed an “asset” is no longer a simple matter. After all, there is more to an airport than tangible things like tarmac, trucks, and buildings. There are also operating authorities; landing rights; software for managing buildings, runways, and baggage; and contracts and licenses. Indeed, the name of the airport itself—its brand—can be one of the more valuable assets. The point: in a modern economy, intangible assets are more prevalent than tangible assets. With this explained, the authors make a key point:
Our central argument in this book is that there is something fundamentally different about intangible investment, and that understanding the steady move to intangible investment helps us understand some of the key issues facing us today: innovation and growth, inequality, the role of management, and financial and policy reform.
With the fundamental point made, the authors enter a discussion of four key traits that give intangible assets a different dynamic in the performance of firms and economies. First, intangibles represent sunk costs that cannot easily be retrieved and sold. Example: Toyota has developed and installed a lean-build production technique that involves investments in human capital and software. It is impossible or very costly to remove lean-build and sell it separately on the market, leaving the tangible assets for another day. The second trait is this: intangibles are associated with spillovers. They are hard to keep under wraps. If a firm has invested in development of a product’s physical shape, design, or operating characteristics, there’s a natural tendency for the new characteristic to escape and become embodied in someone else’s product. Scalability is the third trait. Once produced, intangible asset use can be expanded or duplicated at low cost. Consider a brand like Starbucks, Haskel and Westlake suggest. Once the brand is out there, additional shops can be opened under the banner without incurring high brand development costs. Finally, intangibles tend to be associated with synergies, interactions with other assets that then create productivity gains. Example: improved software enhances a computer system’s operation. Although the authors never use the terminology, they are really rehashing public goods theory, which references “publicness” and “externalities” instead of sunk cost, scalability, and synergies.
Chapter two presents cross-country data on the growth of intangible assets relative to tangible assets. When data are summed across EU countries and the United States, intangible assets began to exceed the value of tangibles around 2008. On the basis of individual countries, intangibles tend to be more prevalent among the Northern Hemisphere countries. Along with data on prevalence, the authors discuss the association of intangibles investment with labor regulation. The data tell us that countries with stricter rules about hiring and firing tend to use relatively fewer intangibles. They are, in effect, sidetracked in the knowledge economy growth contest. Upon seeing the data and reading the discussion, the reader immediately thinks about the rise of the knowledge economy and associated knowledge workers and the related higher wage structure. Those thoughts resonate later with the discussion of income inequality that looms out of the early years of an intangibles-driven economy.
The treatment of the practical matter of how intangibles are defined and counted forms one of the most impressive parts of Capitalism without Capital. The authors point out that the hard work of defining and then counting long-life intangibles was inspired early on by Fritz Machlup’s 1962 The Production and Distribution of Knowledge in the United States, and was later inspired by the recognition and goading by Allen Greenspan, who came to realize that there was more going on in the US economy than was revealed by traditional GDP accounting. A combination of concerns and forces led the US Bureau of Economic Analysis (BEA) to begin a formal effort to improve GDP measurement. In 1999, BEA made software investment a part of GDP calculations. The US effort was followed by that of OECD countries (most notably the United Kingdom) in 2001. As techniques for counting and estimating intangibles improved, various countries developed three asset categories—computerized information, innovative property, and economic competencies—as part of an analytical filing system. With this work and related theoretical work by economists, the stage was set to develop a better understanding of the economic tendencies of intangibles-intensive economies. The authors explain how network effects, economies of scale, falling costs, and changing distributional effects all followed from the new learning.
Capitalism without Capital lays out a strong foundation for understanding and analyzing the modern knowledge economy. Along the way, many questions are answered but a legion of new questions is raised.
I strongly recommend the book.
For a real change of pace, I recommend reading Ethan Hawke’s short but fascinating Rules for a Knight (New York: Alfred A. Knopf, 2015). With just 169 smaller-than-Reader’s-Digest-sized pages, the book is a fable about Hawke’s imaginary Cornish 15th-century ancestor who lived and flourished in the era of knighthood. Hawke’s knight, preparing to go to battle, decides to write a letter for his family, hoping that he can pass along what he considers to be important life lessons. The beautifully constructed little book is more than just a combination of Napoleon Hill’s Think and Grow Rich and Dale Carnegie’s How to Win Friends and Influence People, though it has some of the qualities of those two all-time favorite self-improvement books. This is so because of the book’s story-like quality as well as the fact that it is built of 20 very short lessons—each in a dreamlike setting—that address a particular rule. Examples of the rules include solitude, humility, gratitude, honesty, patience, justice, love, and death. Hawke indicates that the book’s inspiration arose in discussions with his wife when talking about the child-rearing challenges and the relative merits of having some family rules. I like the book and think many of its chapters lend themselves to being read aloud to small children.

